
At the next FAO update, will the m3 of wood fuel produced within the European Union increase?
https://www.fao.org/faostat/en/#data/FO
(domain code = F0, Area code = 097, element code = 5516, item code = 1
 1,000
1,000 3.00
3.00@SirCryptomind We don't need to wait for 2023 data, it just needs to be "the next update". And the next update after the question was posted was the 2022 data, not 2023.
See my post below with the exact figures. The 2022 figure's release should have immediately caused this to resolve Yes.
The update history is here, you can see the updates have been made since this market was created.
https://fenixservices.fao.org/faostat/static/documents/FO/FO_Update_History.pdf
My guess is the 2022 data was added in the 2023-12-21 update, right before I found it on 2023-12-24.
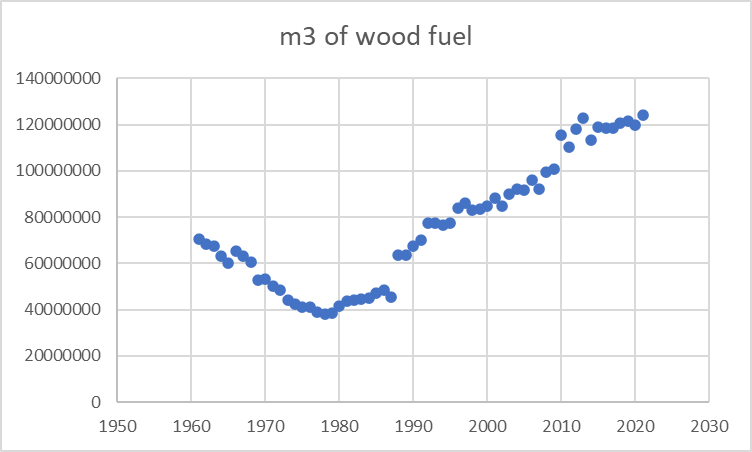
It went up.
The graph image in the screen shows a dot on 119551015 for 2020, and a dot on 126562947 for 2021, but no dot for 2022. The screenshot I have shows the data for 2022, it is larger, 126562947.
The description cuts off on the item code, but it should say 1864.