

Current external standard (recommended by Ben Adams): https://ourworldindata.org/grapher/global-energy-substitution?time=1950..latest
The winner is whatever energy source generates most of the world's energy in 2030. This isn't limited only to electricity generation.
 1,000
1,000 3.00
3.00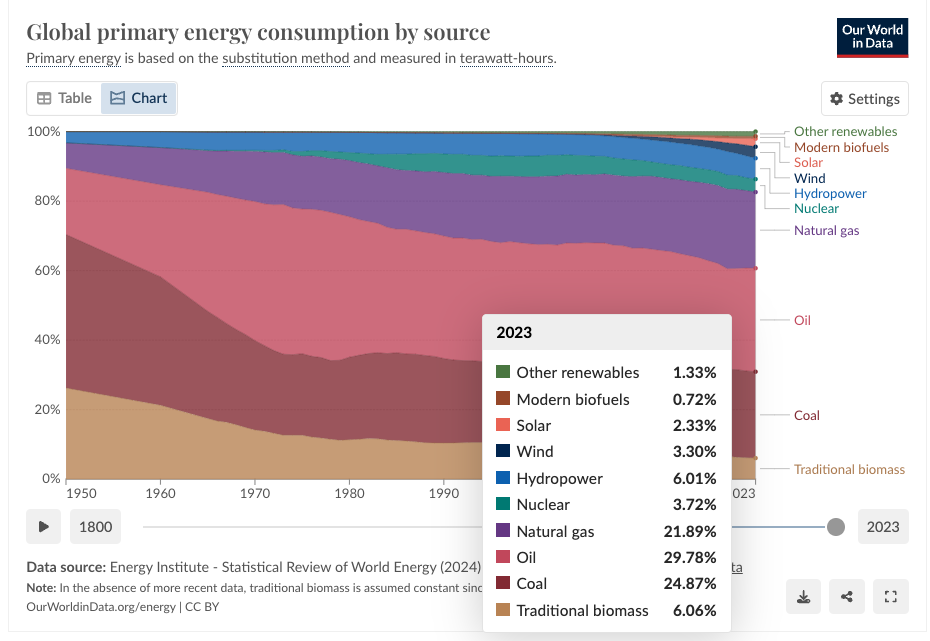
If we look at the our world on data chart, we can see that change is very slow. Why would it shift that strong in only 7 years (e.g. to solar)? Where does natural gas replace oil, except for heating?
Ok I think I have an idea of how to update the criteria. Use this metric from the Energy institute statistical review.
Global primary energy consumption by source (ourworldindata.org)
As measured by what? Total global capacity? Is "dominant" just whatever is the biggest share? All electricity or all energy? We need more detail